
Calls
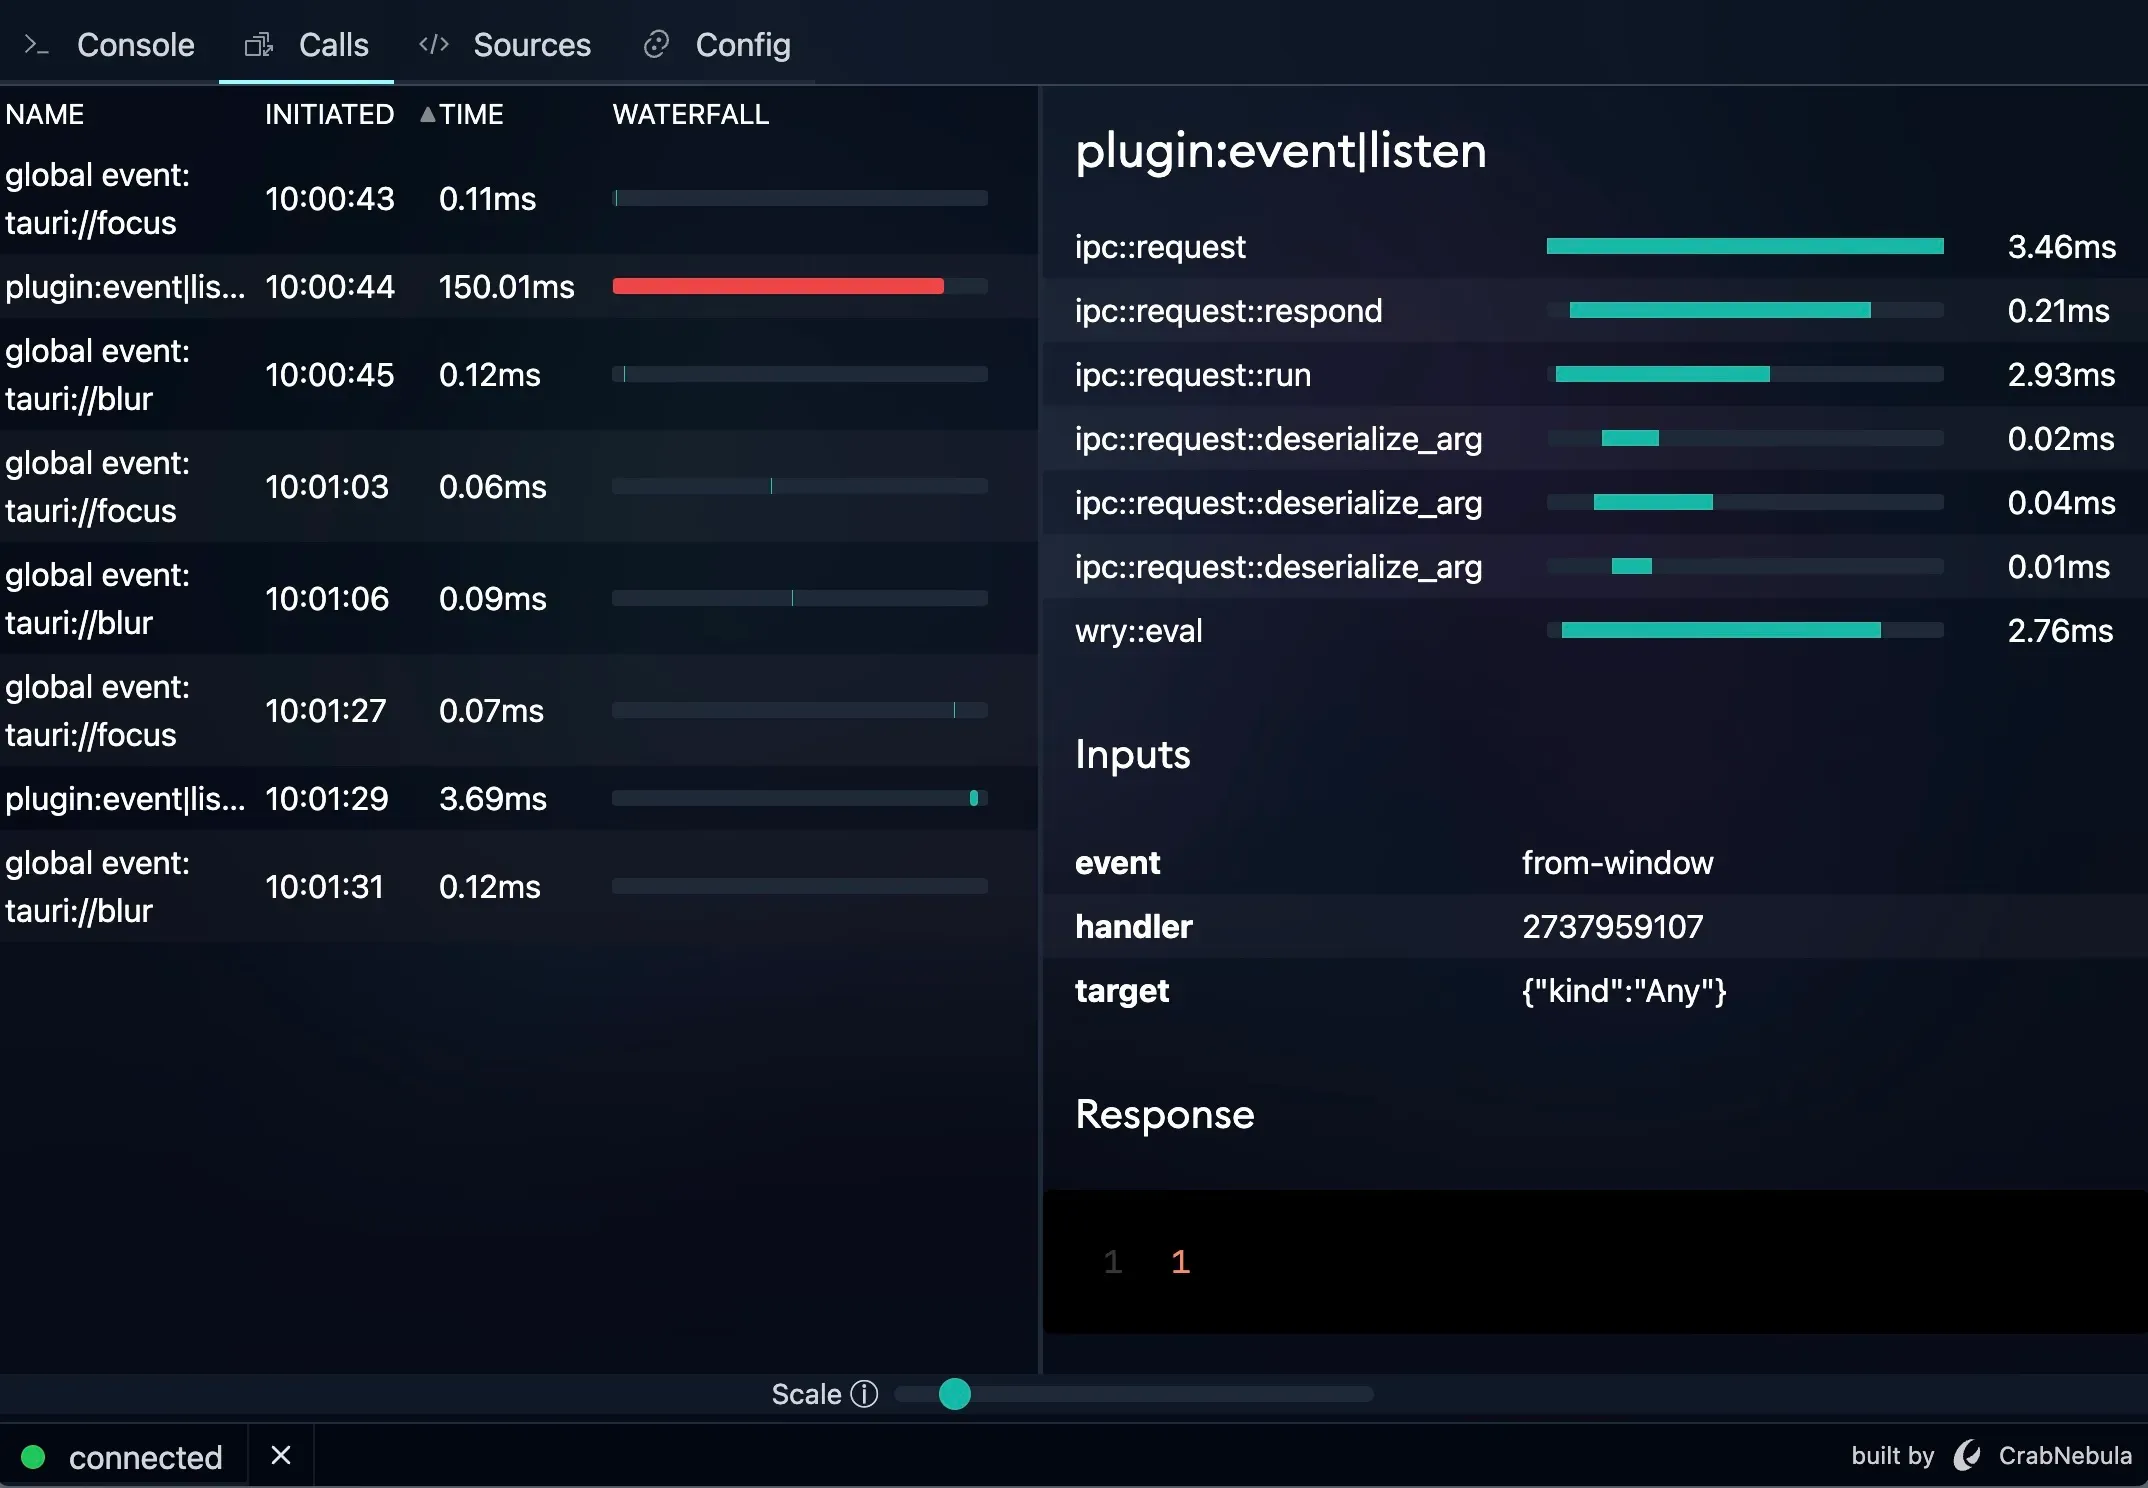
The Calls tab lists performance-relevant events such as IPC Calls, or events. You will find them in a list sorted
from oldest to newest, with every event featuring high-level timing information at a glance.
The Initiated column tells you when, in wall clock time, the event started and Time lets you know how long it took.
The Waterfall column is designed to give you a rough idea of how performance events relate to each other,
though for long-running debugging sessions the waterfall view might not be as helpful anymore since blocks will
get narrower as time progresses due to being squished by the scale.

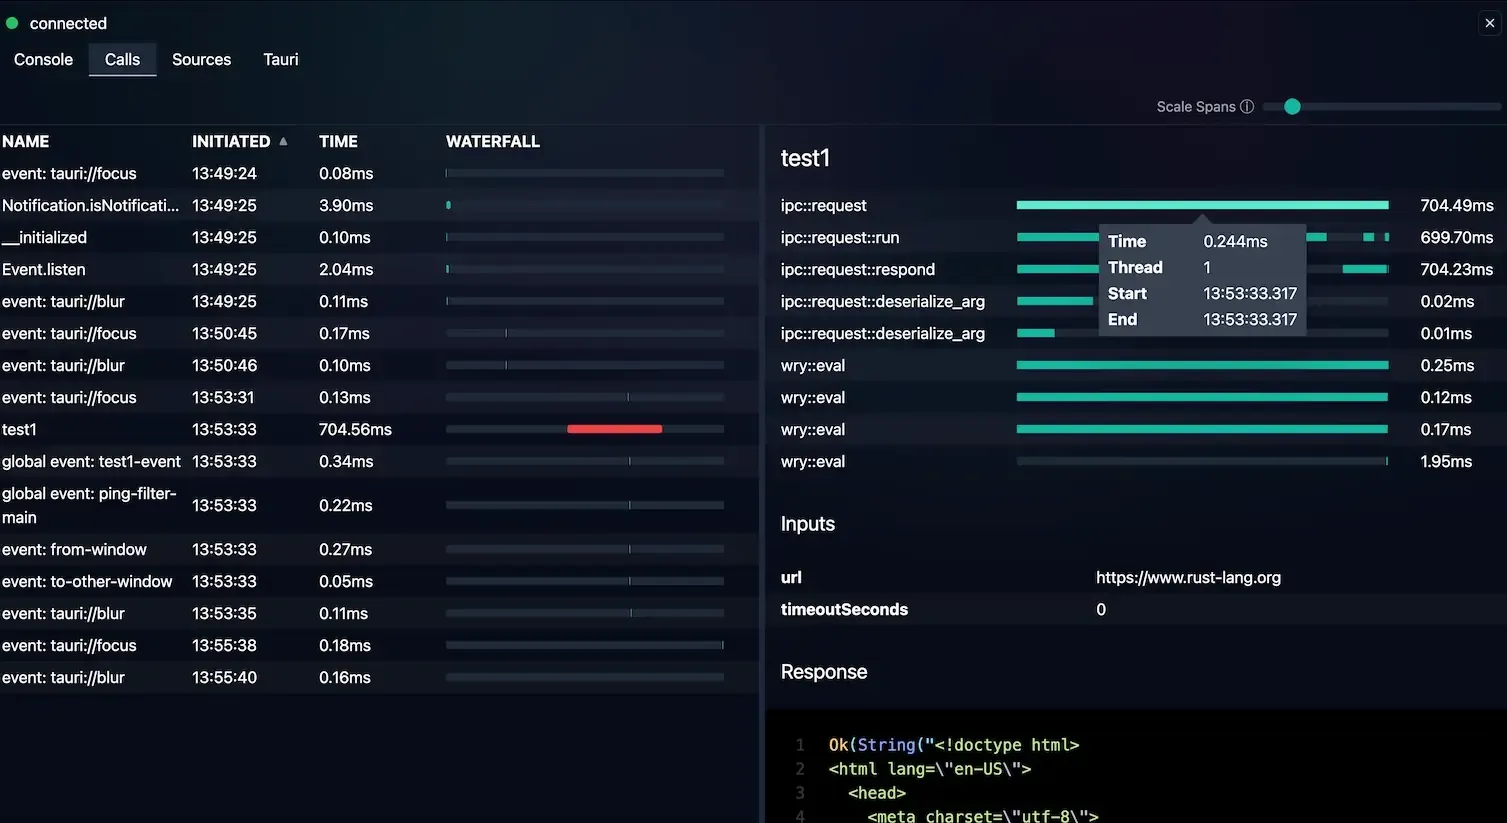
Clicking on a performance event will reveal the meaty details about an event. Here you will find IPC parameters and response, and what code contributed how much to the total duration of the event.
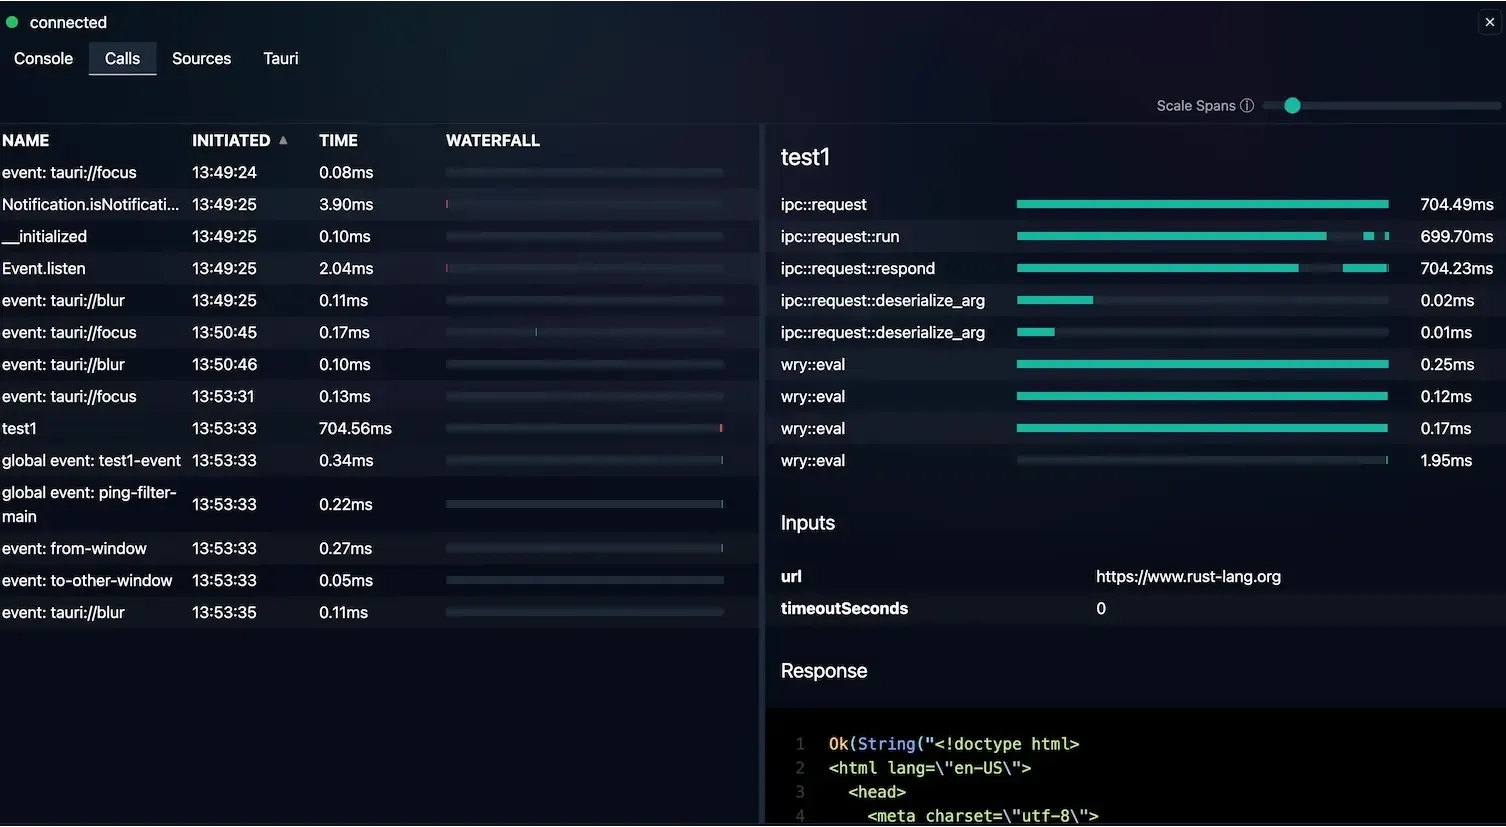
The event inputs are the IPC parameters that the WebView (your frontend code) passed to the Rust core. Event inputs are listed here, so you can quickly gauge whether your frontend code is passing the right values. Note that the values here are captured after being deserialized by Rust, so if there are any inconsistencies in the deserialization they will show up here as well.
The event response is the return value of the Rust function that has been invoked and what has been passed back the WebView. This data is captured before it has been serialized and passed to the WebView though, that’s the reason why it looks like a Rust type. This also means that issues or inconsistencies with serialization and evaluation in the WebView are not recorded.
The waterfall section at the top of the details panel shows a breakdown of the whole event duration by its individual spans (spans are durations of time). This lets you see exactly how much time is spent where during the execution of an IPC call. Currently, DevTools tracks the following spans:
ipc::request- This is the whole duration of your IPC call.ipc::request::run- This span tracks the execution of your handler function (essentially the function you annotated with#[tauri::command])ipc::request::respond- This tracks how long responding to your request took, this will happen afteripc::request::run.ipc::request::deserialize_arg- This tracks how long deserializing an individual IPC parameter took.wry::eval- This represents the time it takes to send something to the WebView proper. This is usually the last span of an IPC request.
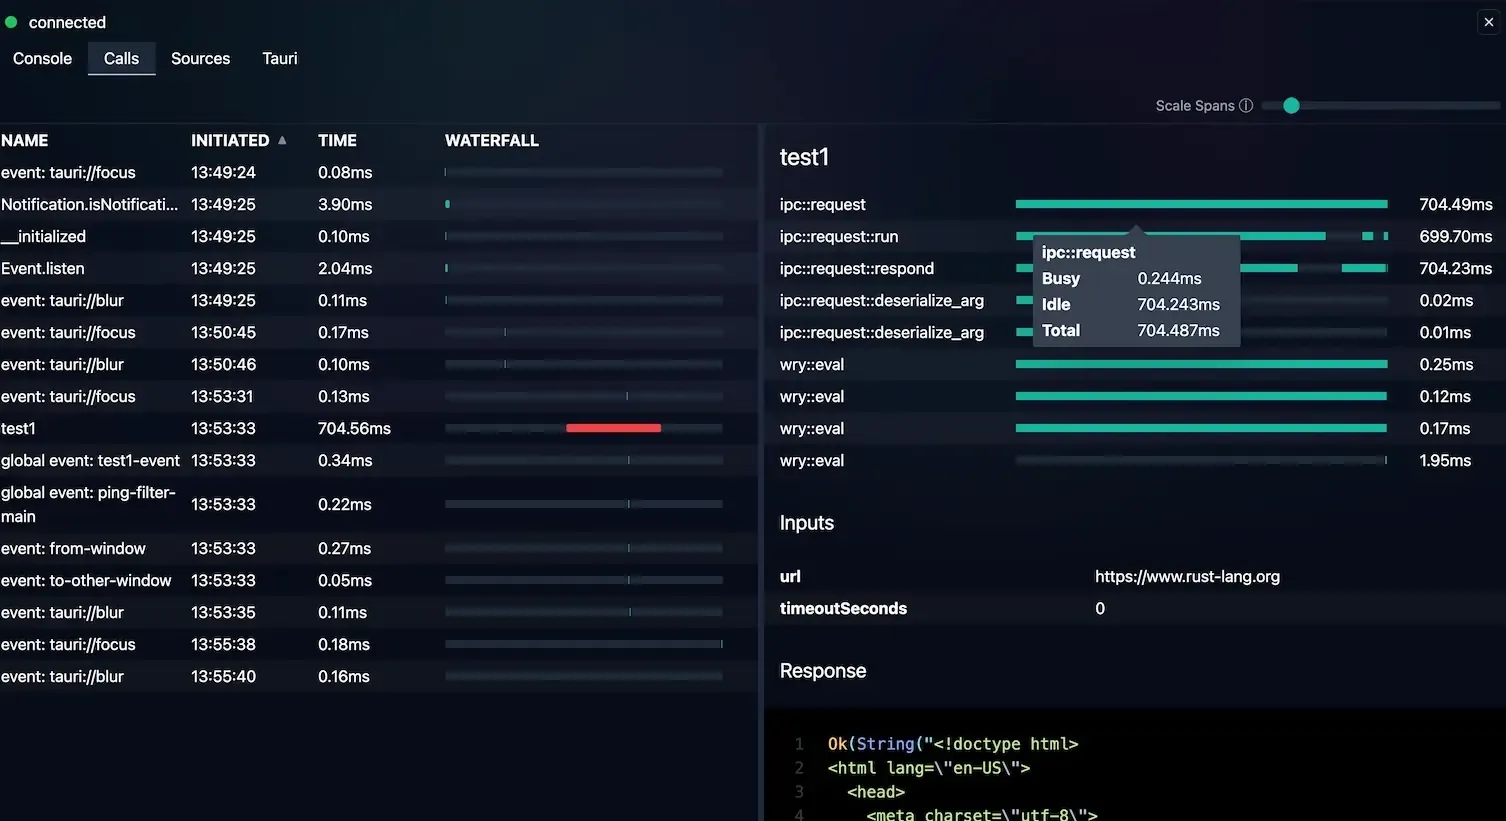
Note that clicking a spans row will reveal additional information about that component in a dropdown as shown in the screenshot above.
Because of Tauri’s asynchronous and multithreaded nature, spans can be entered and exited multiple times, e.g. when waiting for some disk IO operation to complete, the scheduler will pause the executing code and resume it once the operation is done. This shows in the waterfall views through multiple disjoint blocks called Work Units (a unit of work has been performed). Each colored block means there has been code executing during that time, transparent sections in between indicate the work has been paused by waiting on something else.
You can click on a work unit to reveal more information about it, such as detailed timing information and which underlying thread actually performed the work (work can be shifted around between multiple threads in the thread pool) this can be helpful to detect situations where work is shifted between threads unnecessarily.